infographics-year-2016
Infographics of year 2016
This page contains a gallery of infographics used in our publications. They provide a visual snapshot of the highlights of the publication. To download a high resolution copy of the graphic or to browse the publication itself, click on the image.
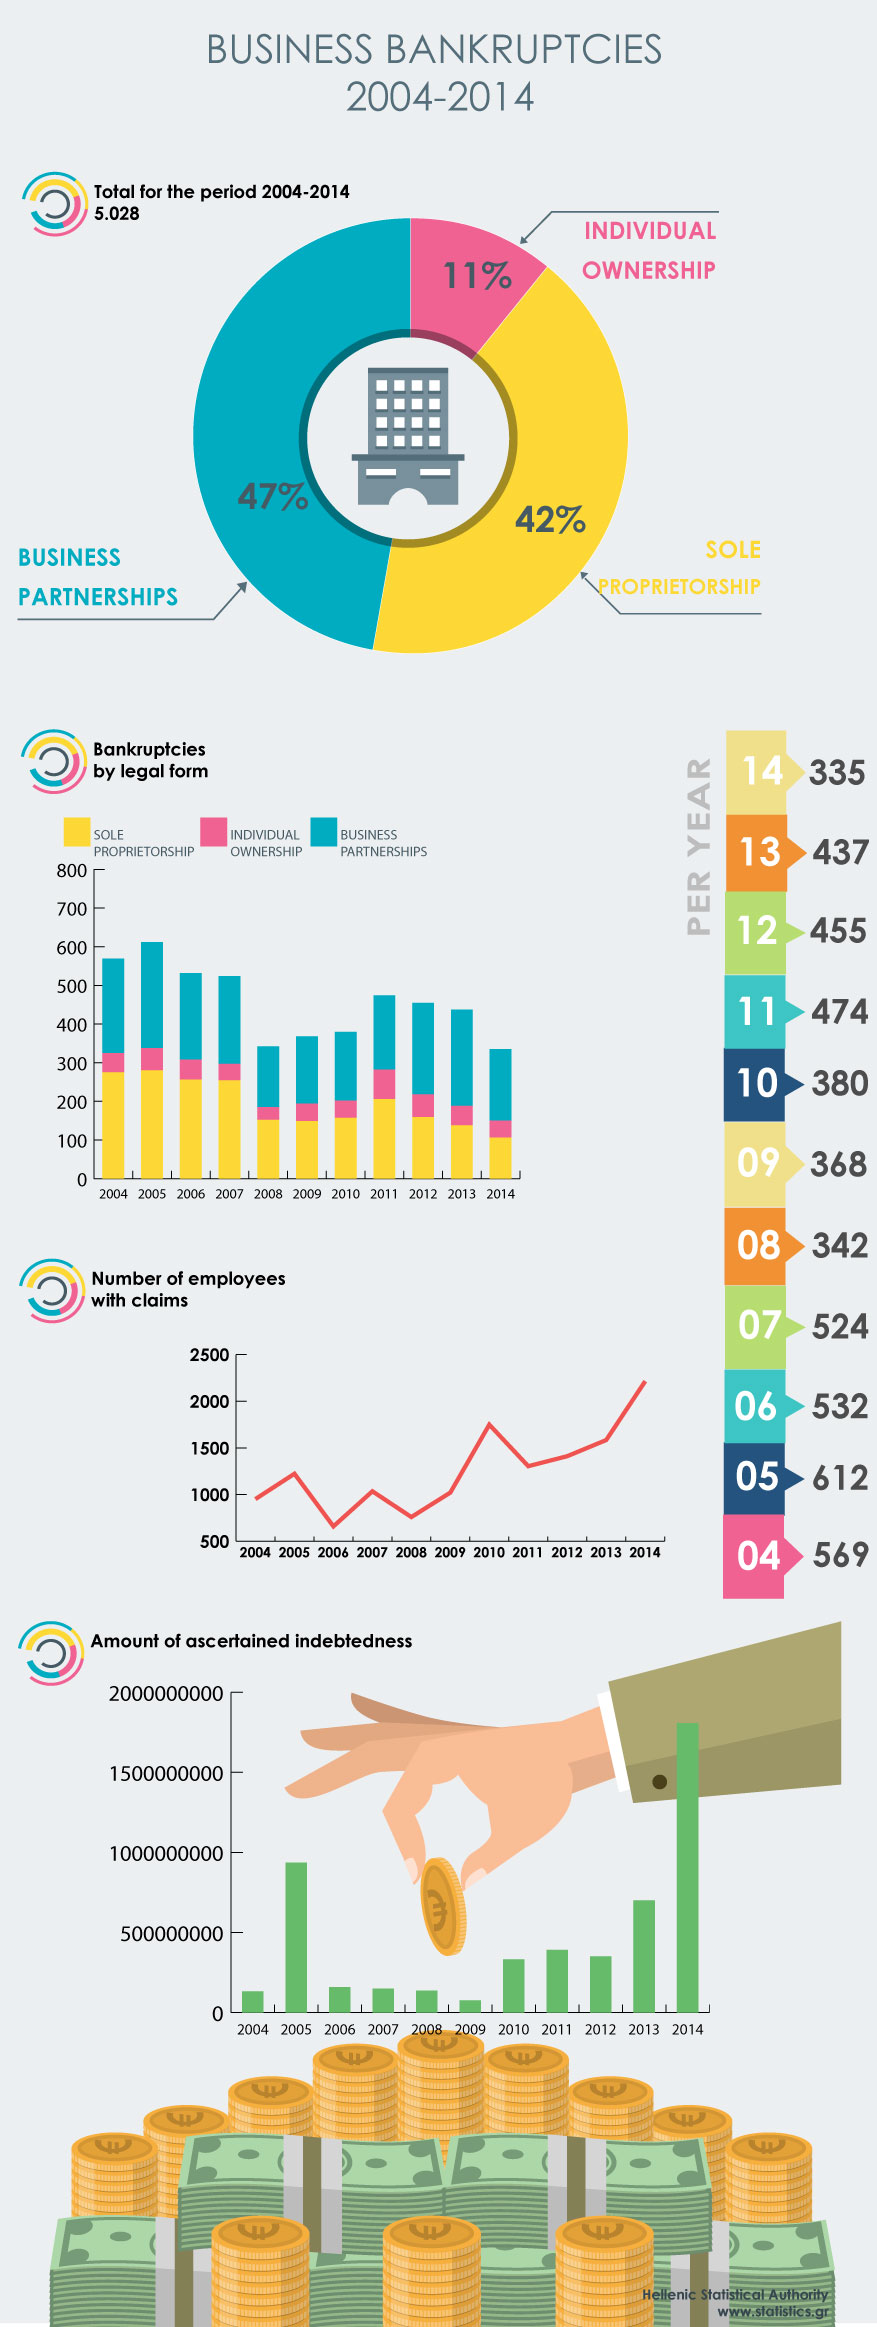
29.12.2016
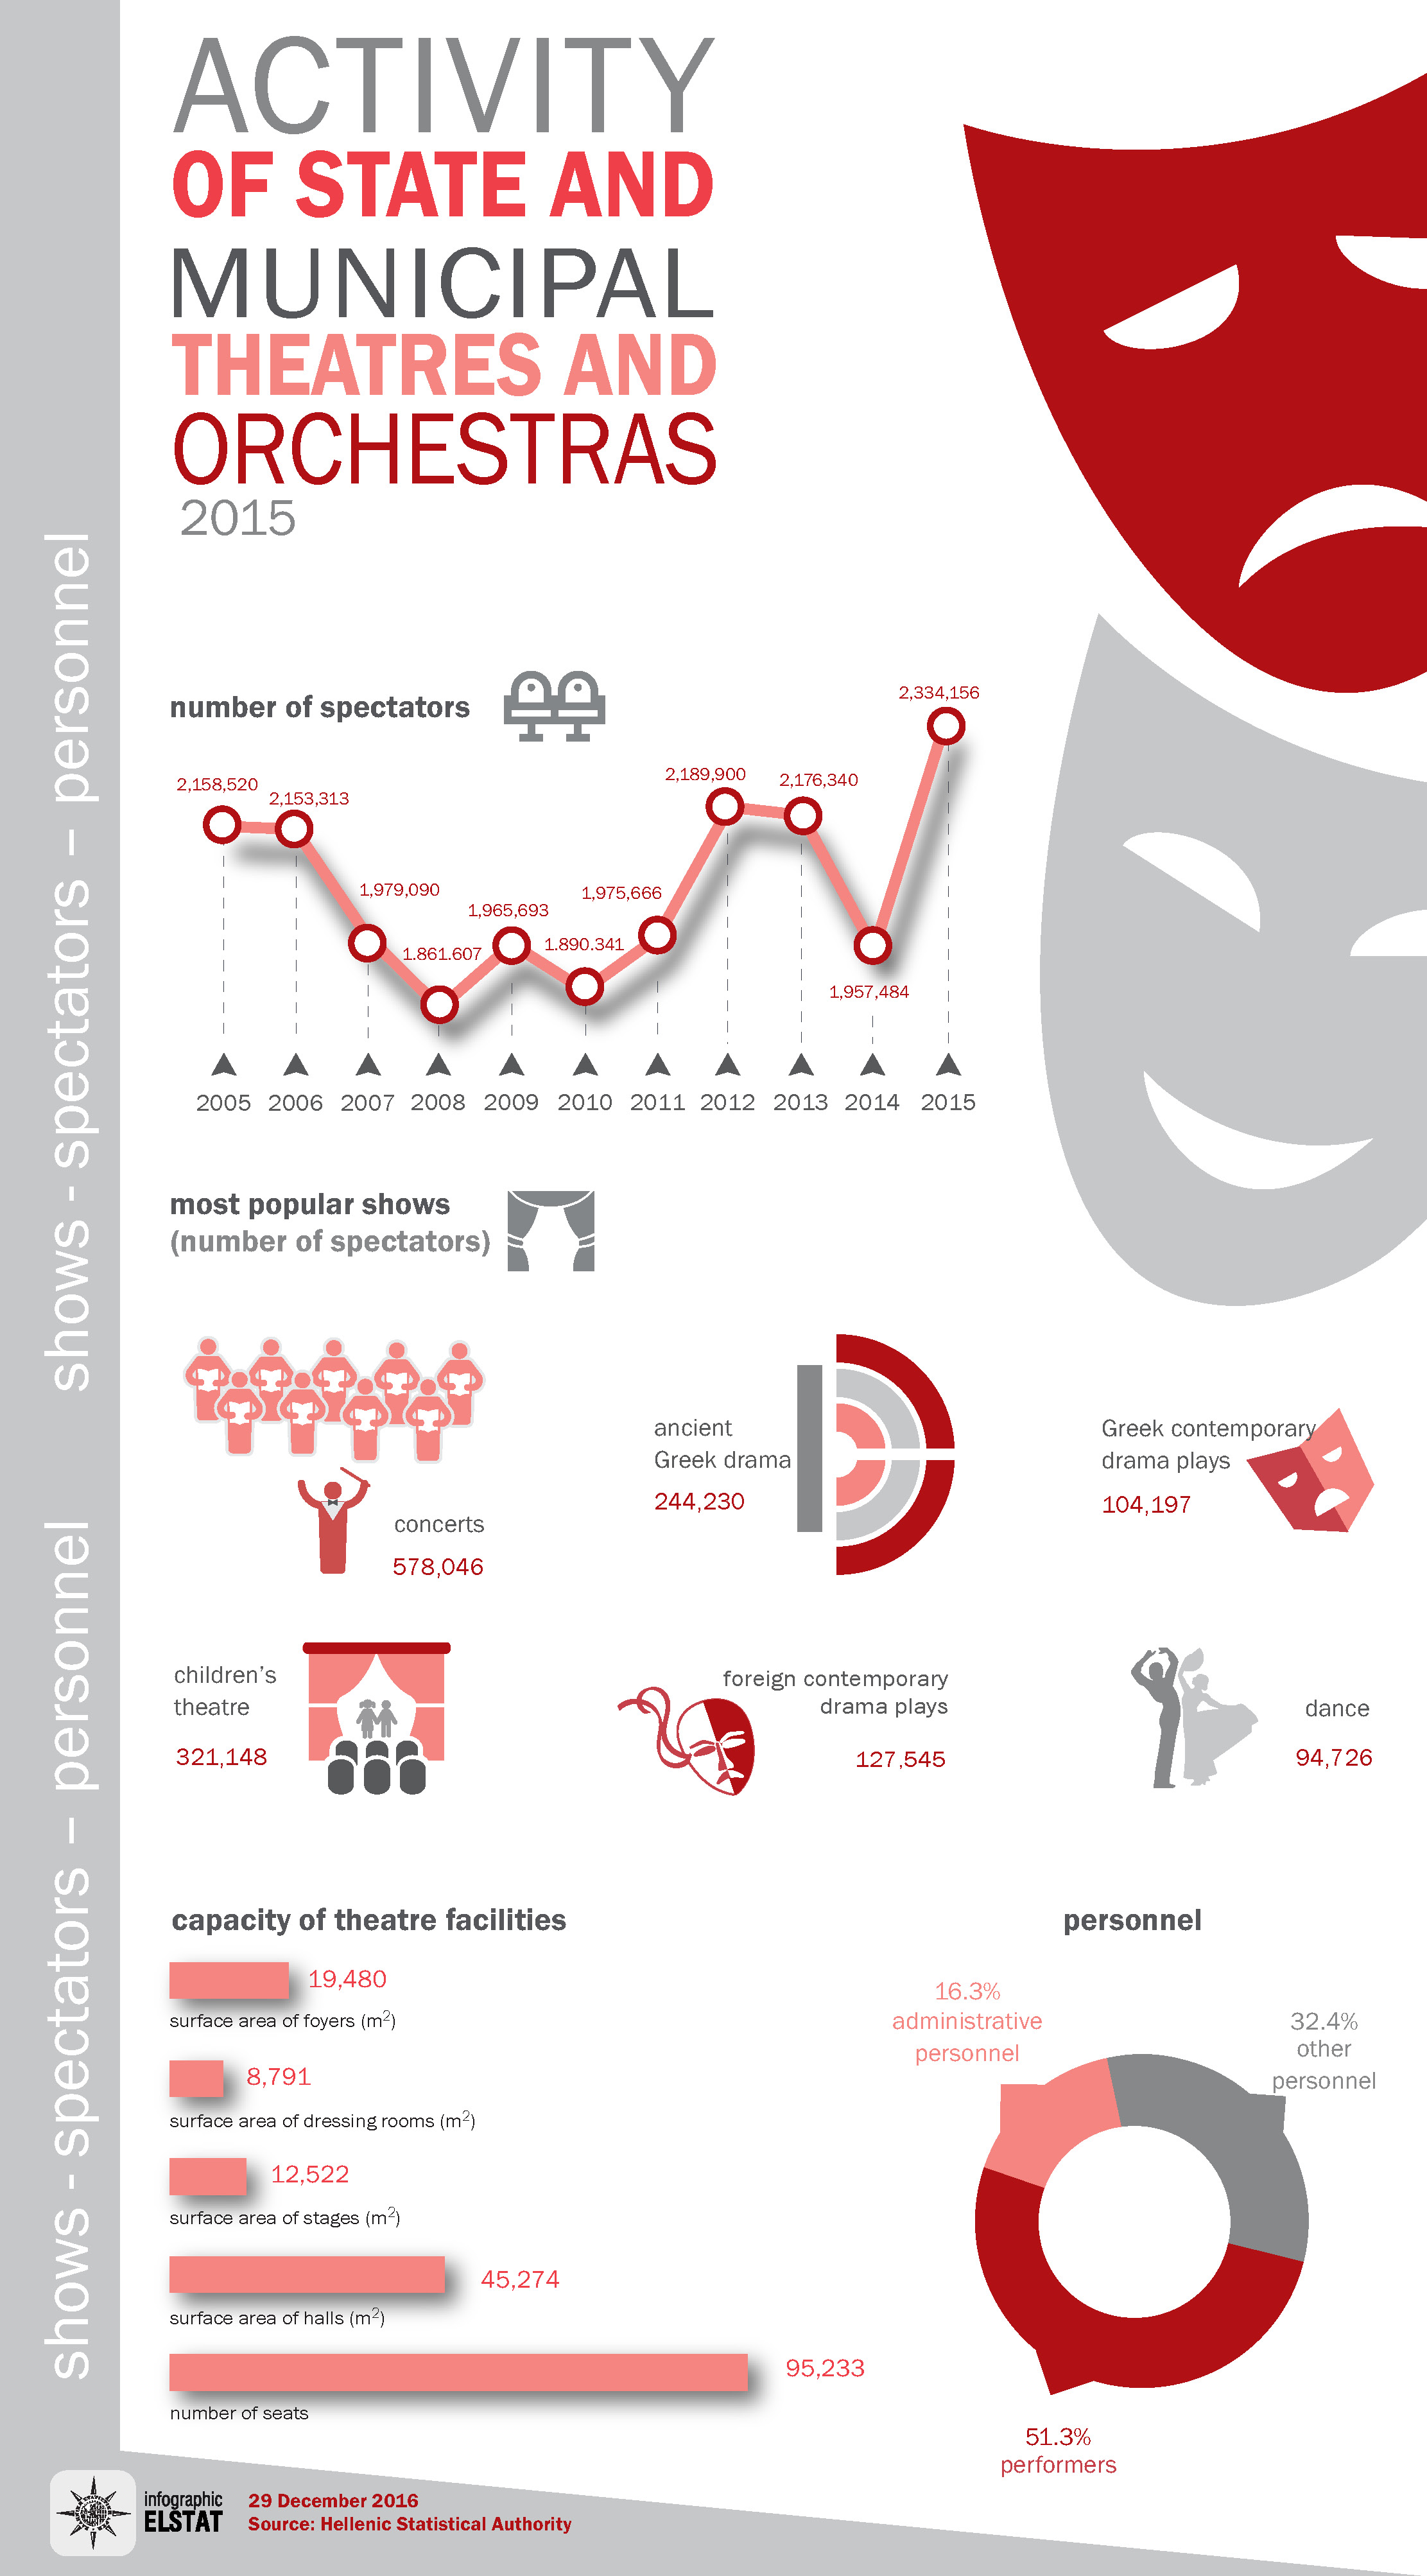
2015 Survey on Theatres and Orchestras
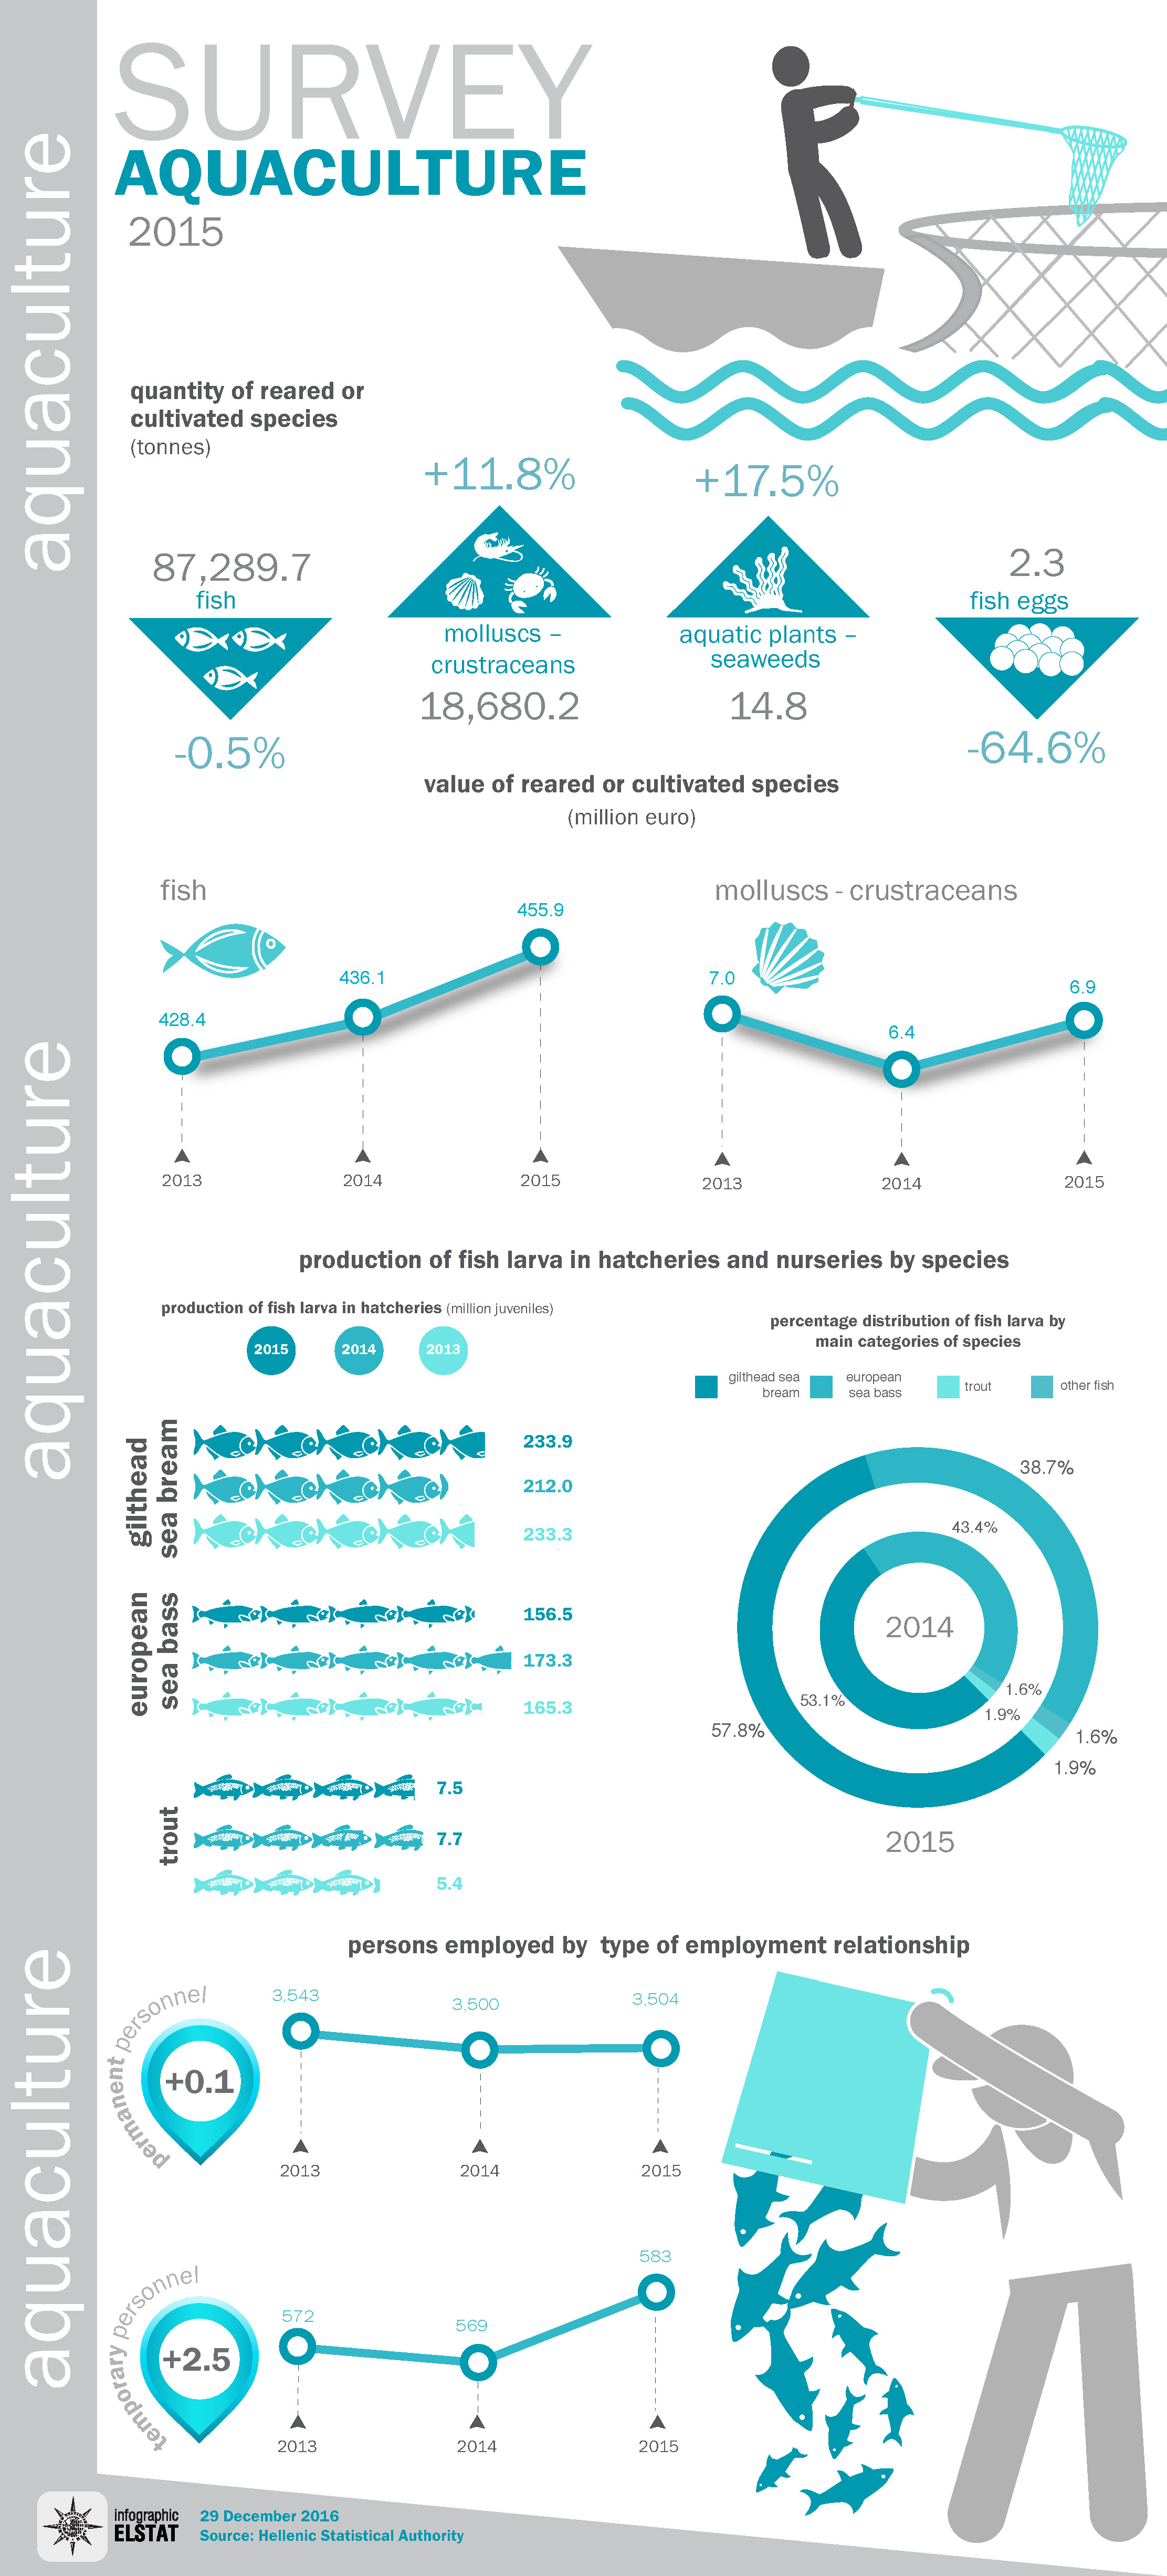
29.12.2016
2015 Survey on Aquaculture
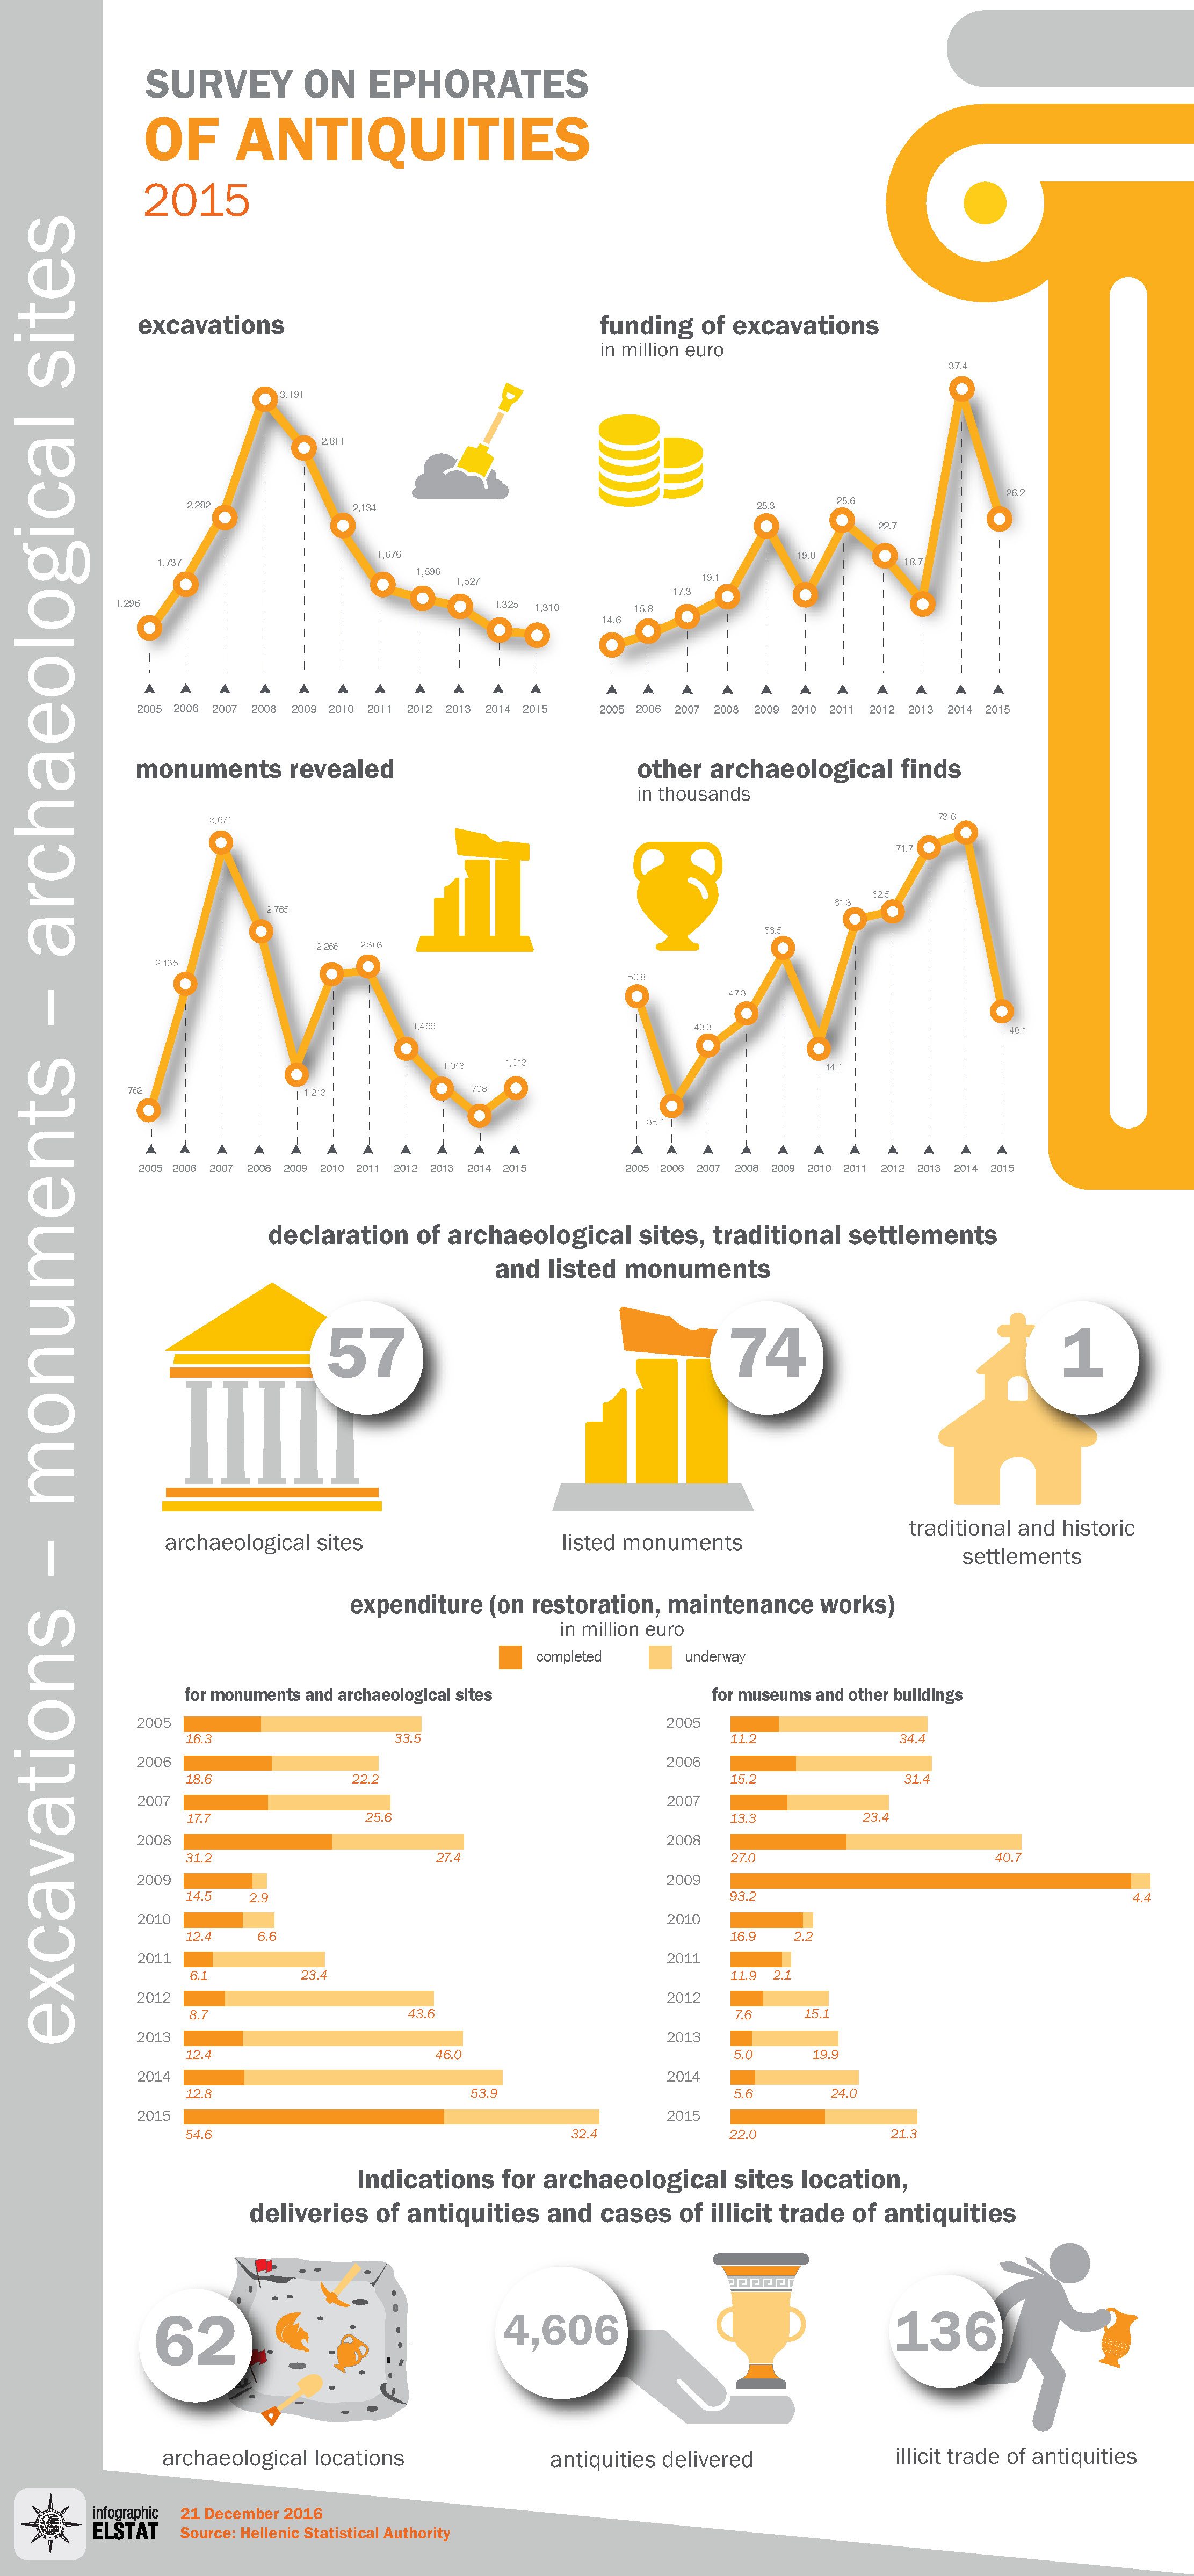
21.12.2016
2015 Survey on Ephorates of Antiquities
20.12.2016
2015 Physicians and dentists
14.12.2016
2016 Use of Information and Communication Technologies by households and individuals (ICT)
14.12.2016
2016 Use of Information and Communication Technologies and e-commerce in enterprises
9.12.2016
Secondary Vocational Education 2014/2015
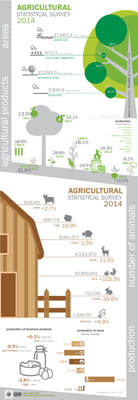
8.12.2016
2014 Agricultural Statistical Survey
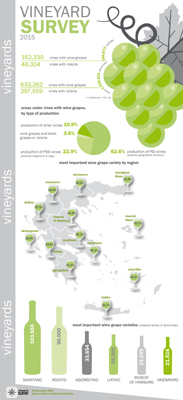
30.11.2016
2015 Vineyard Survey
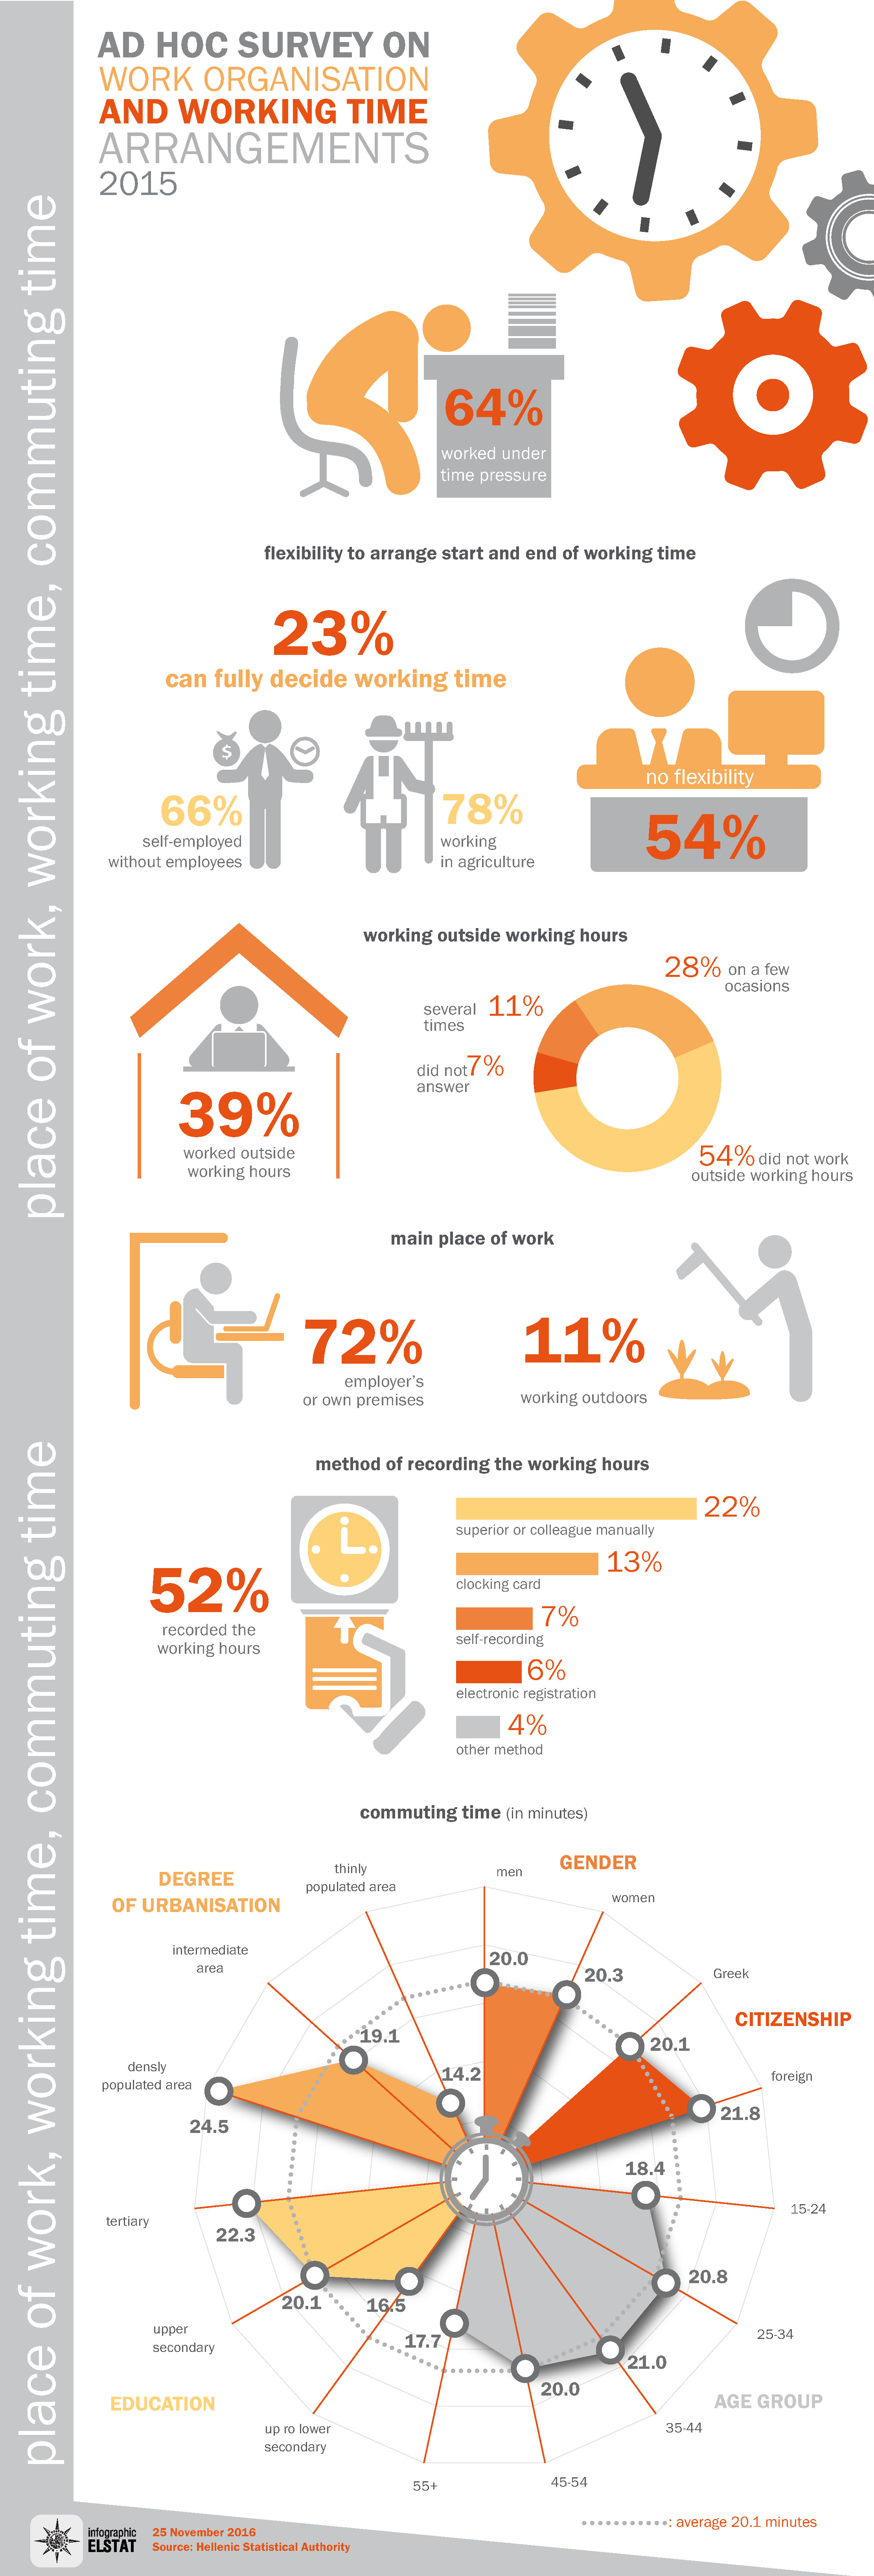
25.11.2016
Work Organisation and Working Time Arrangements, 2015
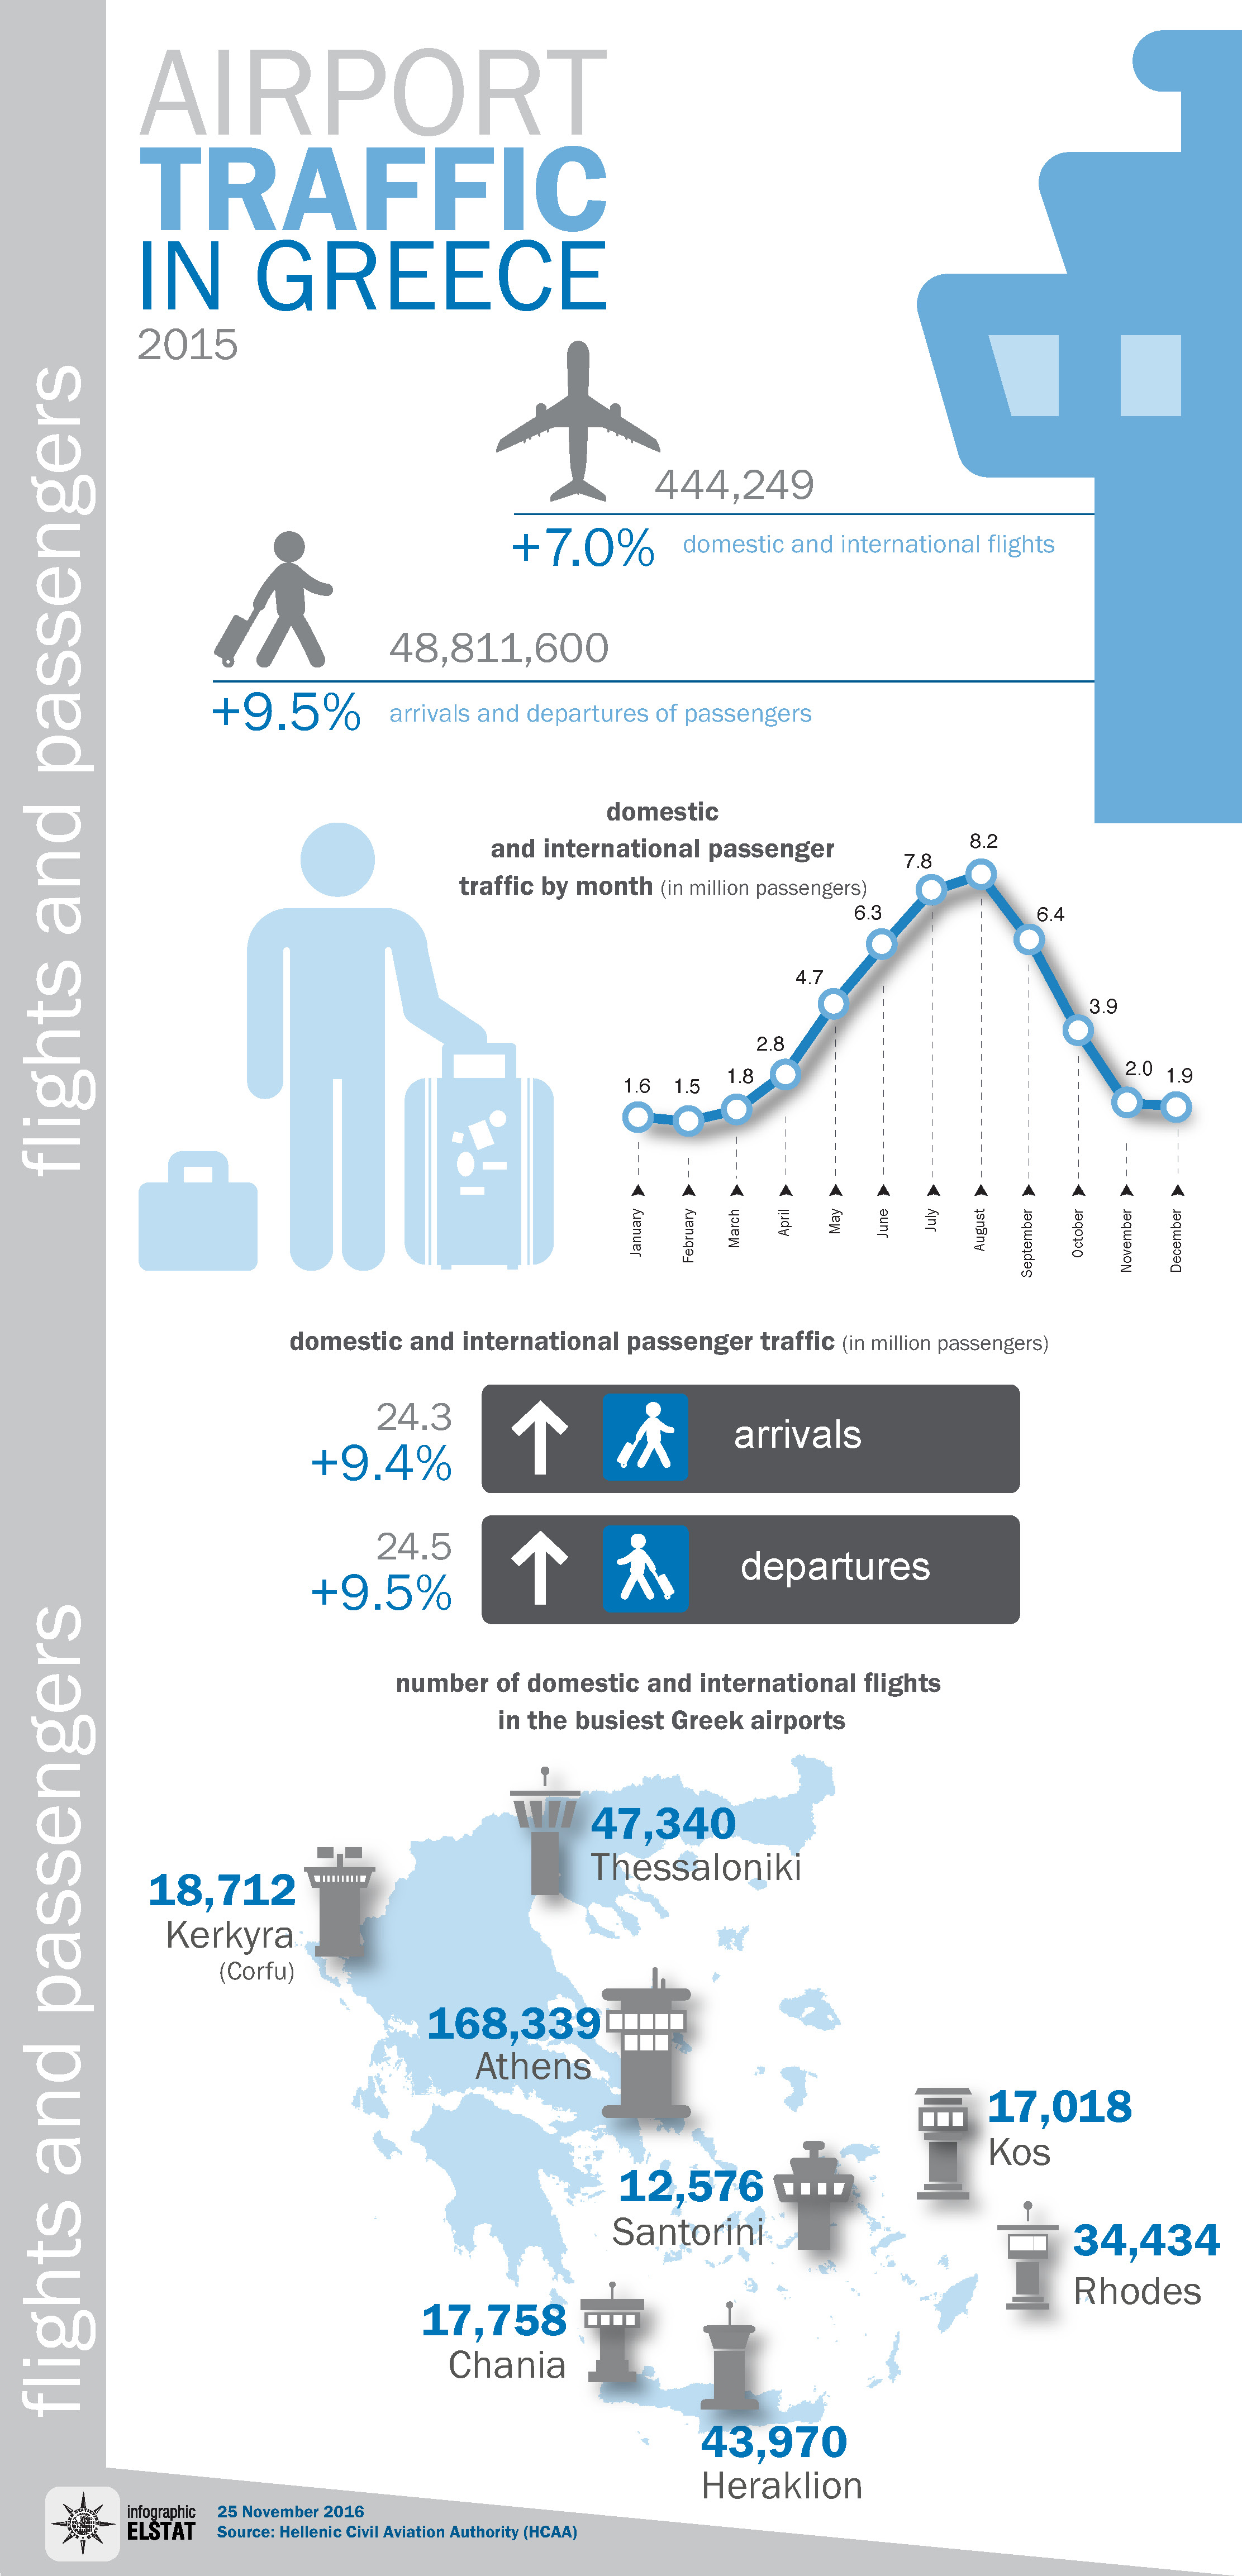
25.11.2016
Airport Traffic in Greece, 2013-2015
11.11.2016
2016 Use of Information and Communication Technologies by households and individuals (ICT)
9.11.2016
Secondary Education Statistics 2014/2015
2.11.2016
2015 Adoptions
31.10.2016
2014 Accidents at work
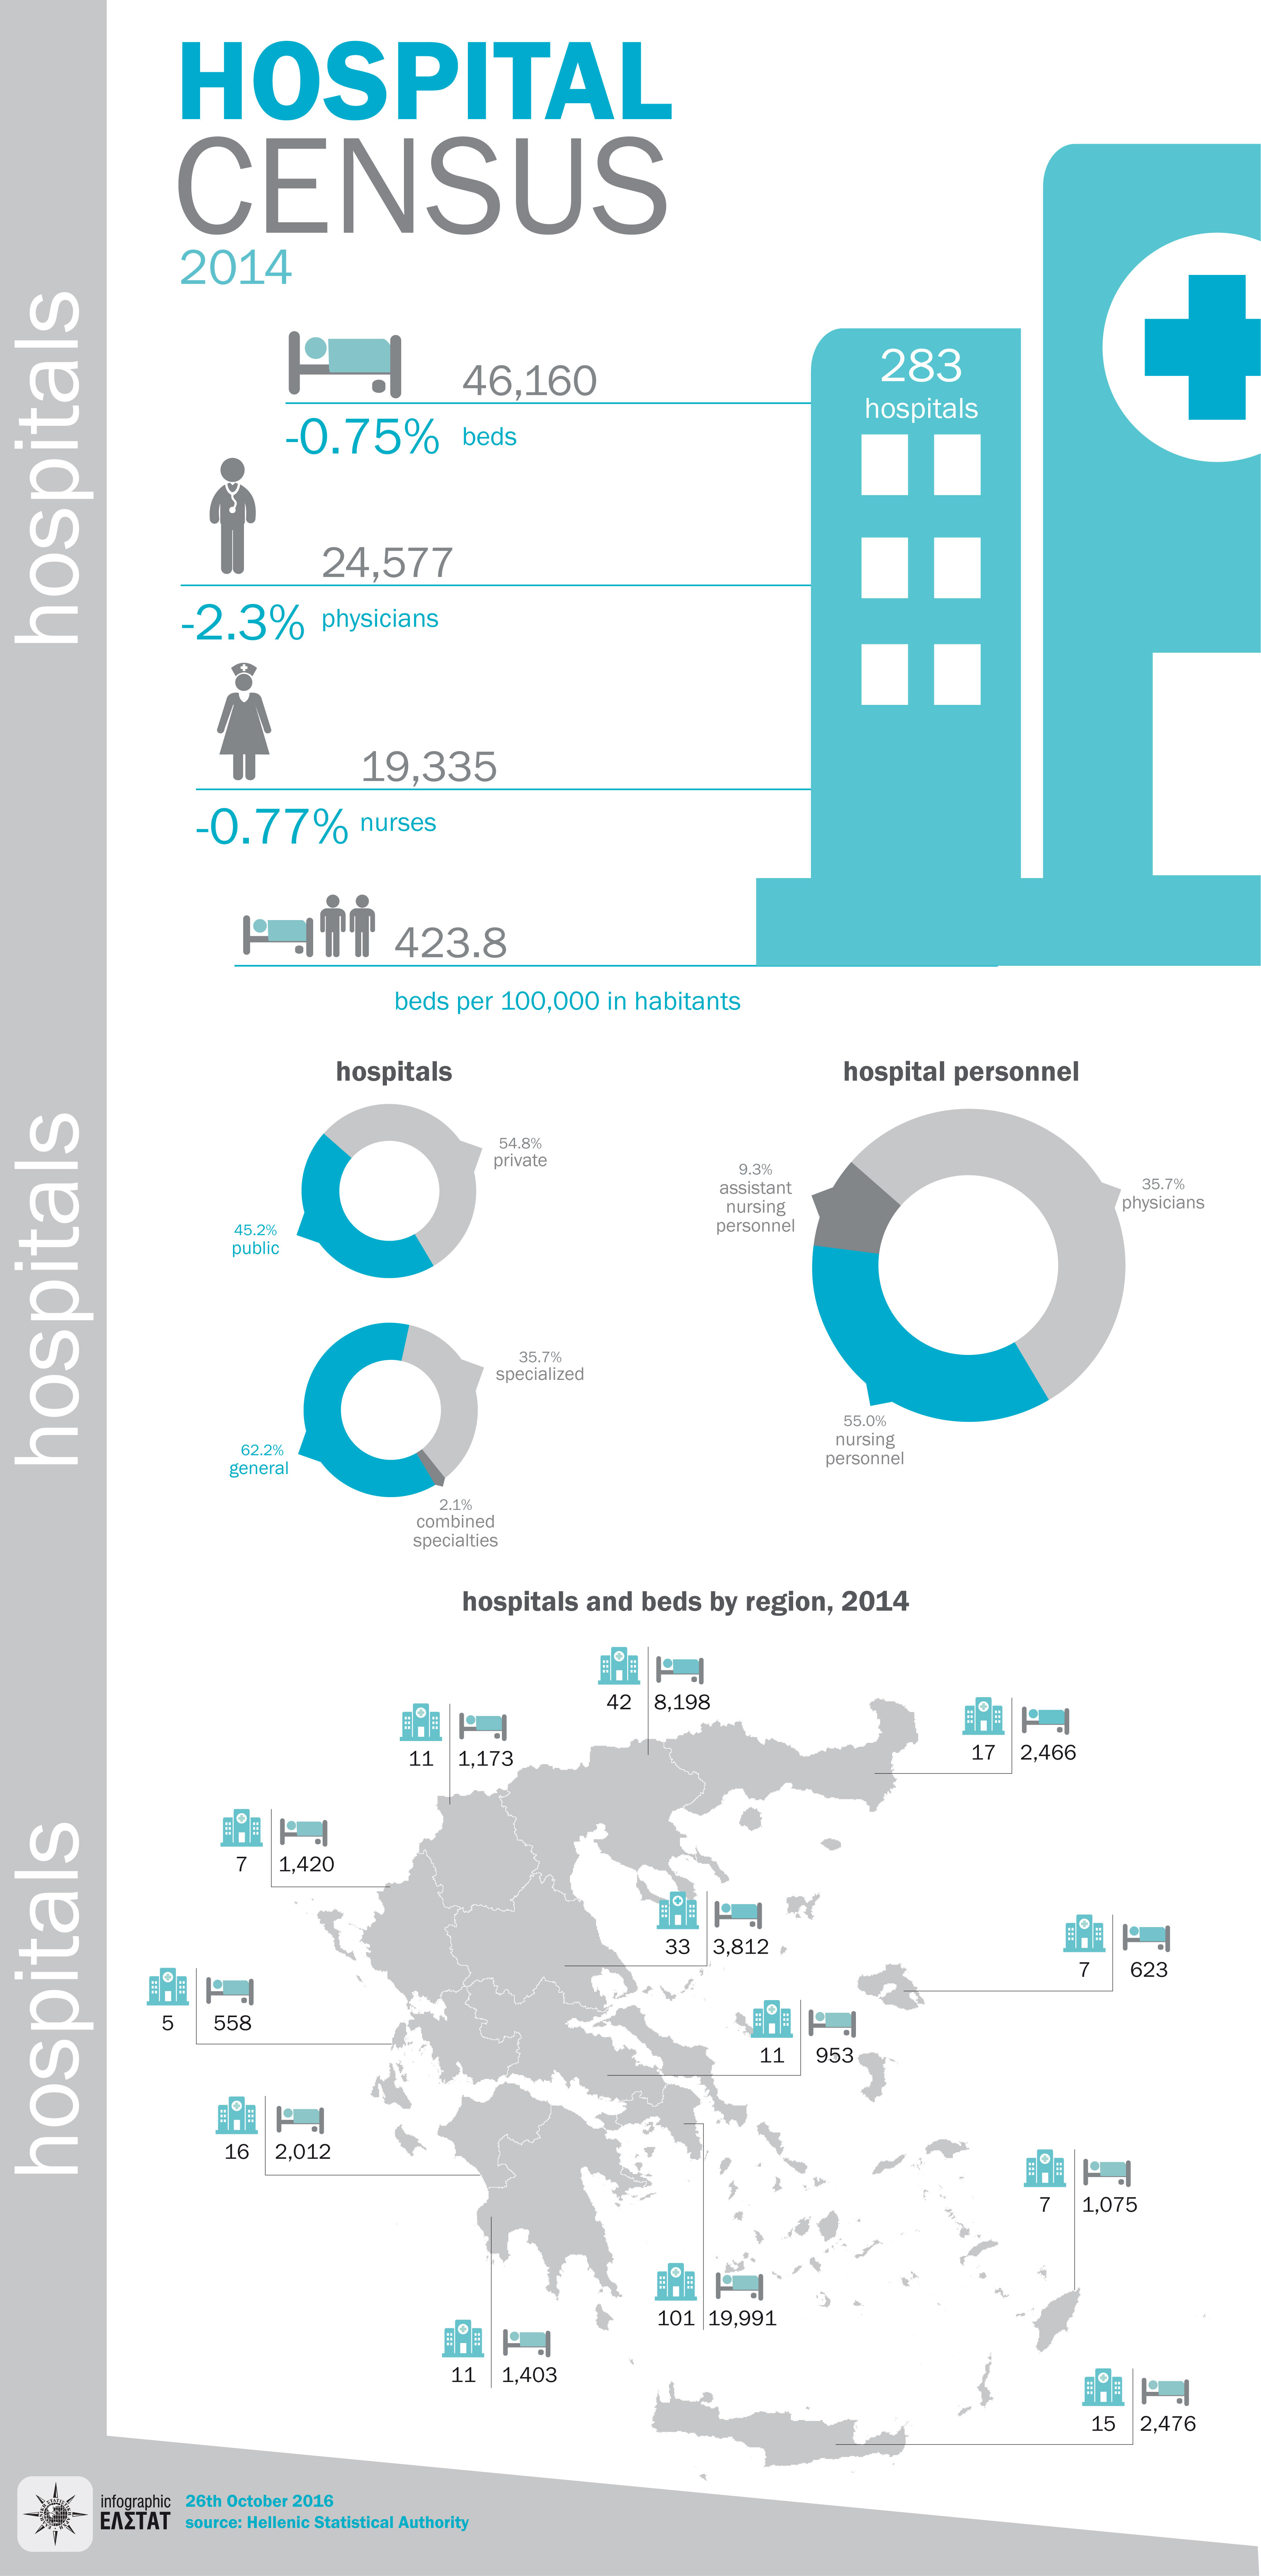
26.10.2016
2014 Hospital Census

26.10.2016
2015 Cases of infectious diseases
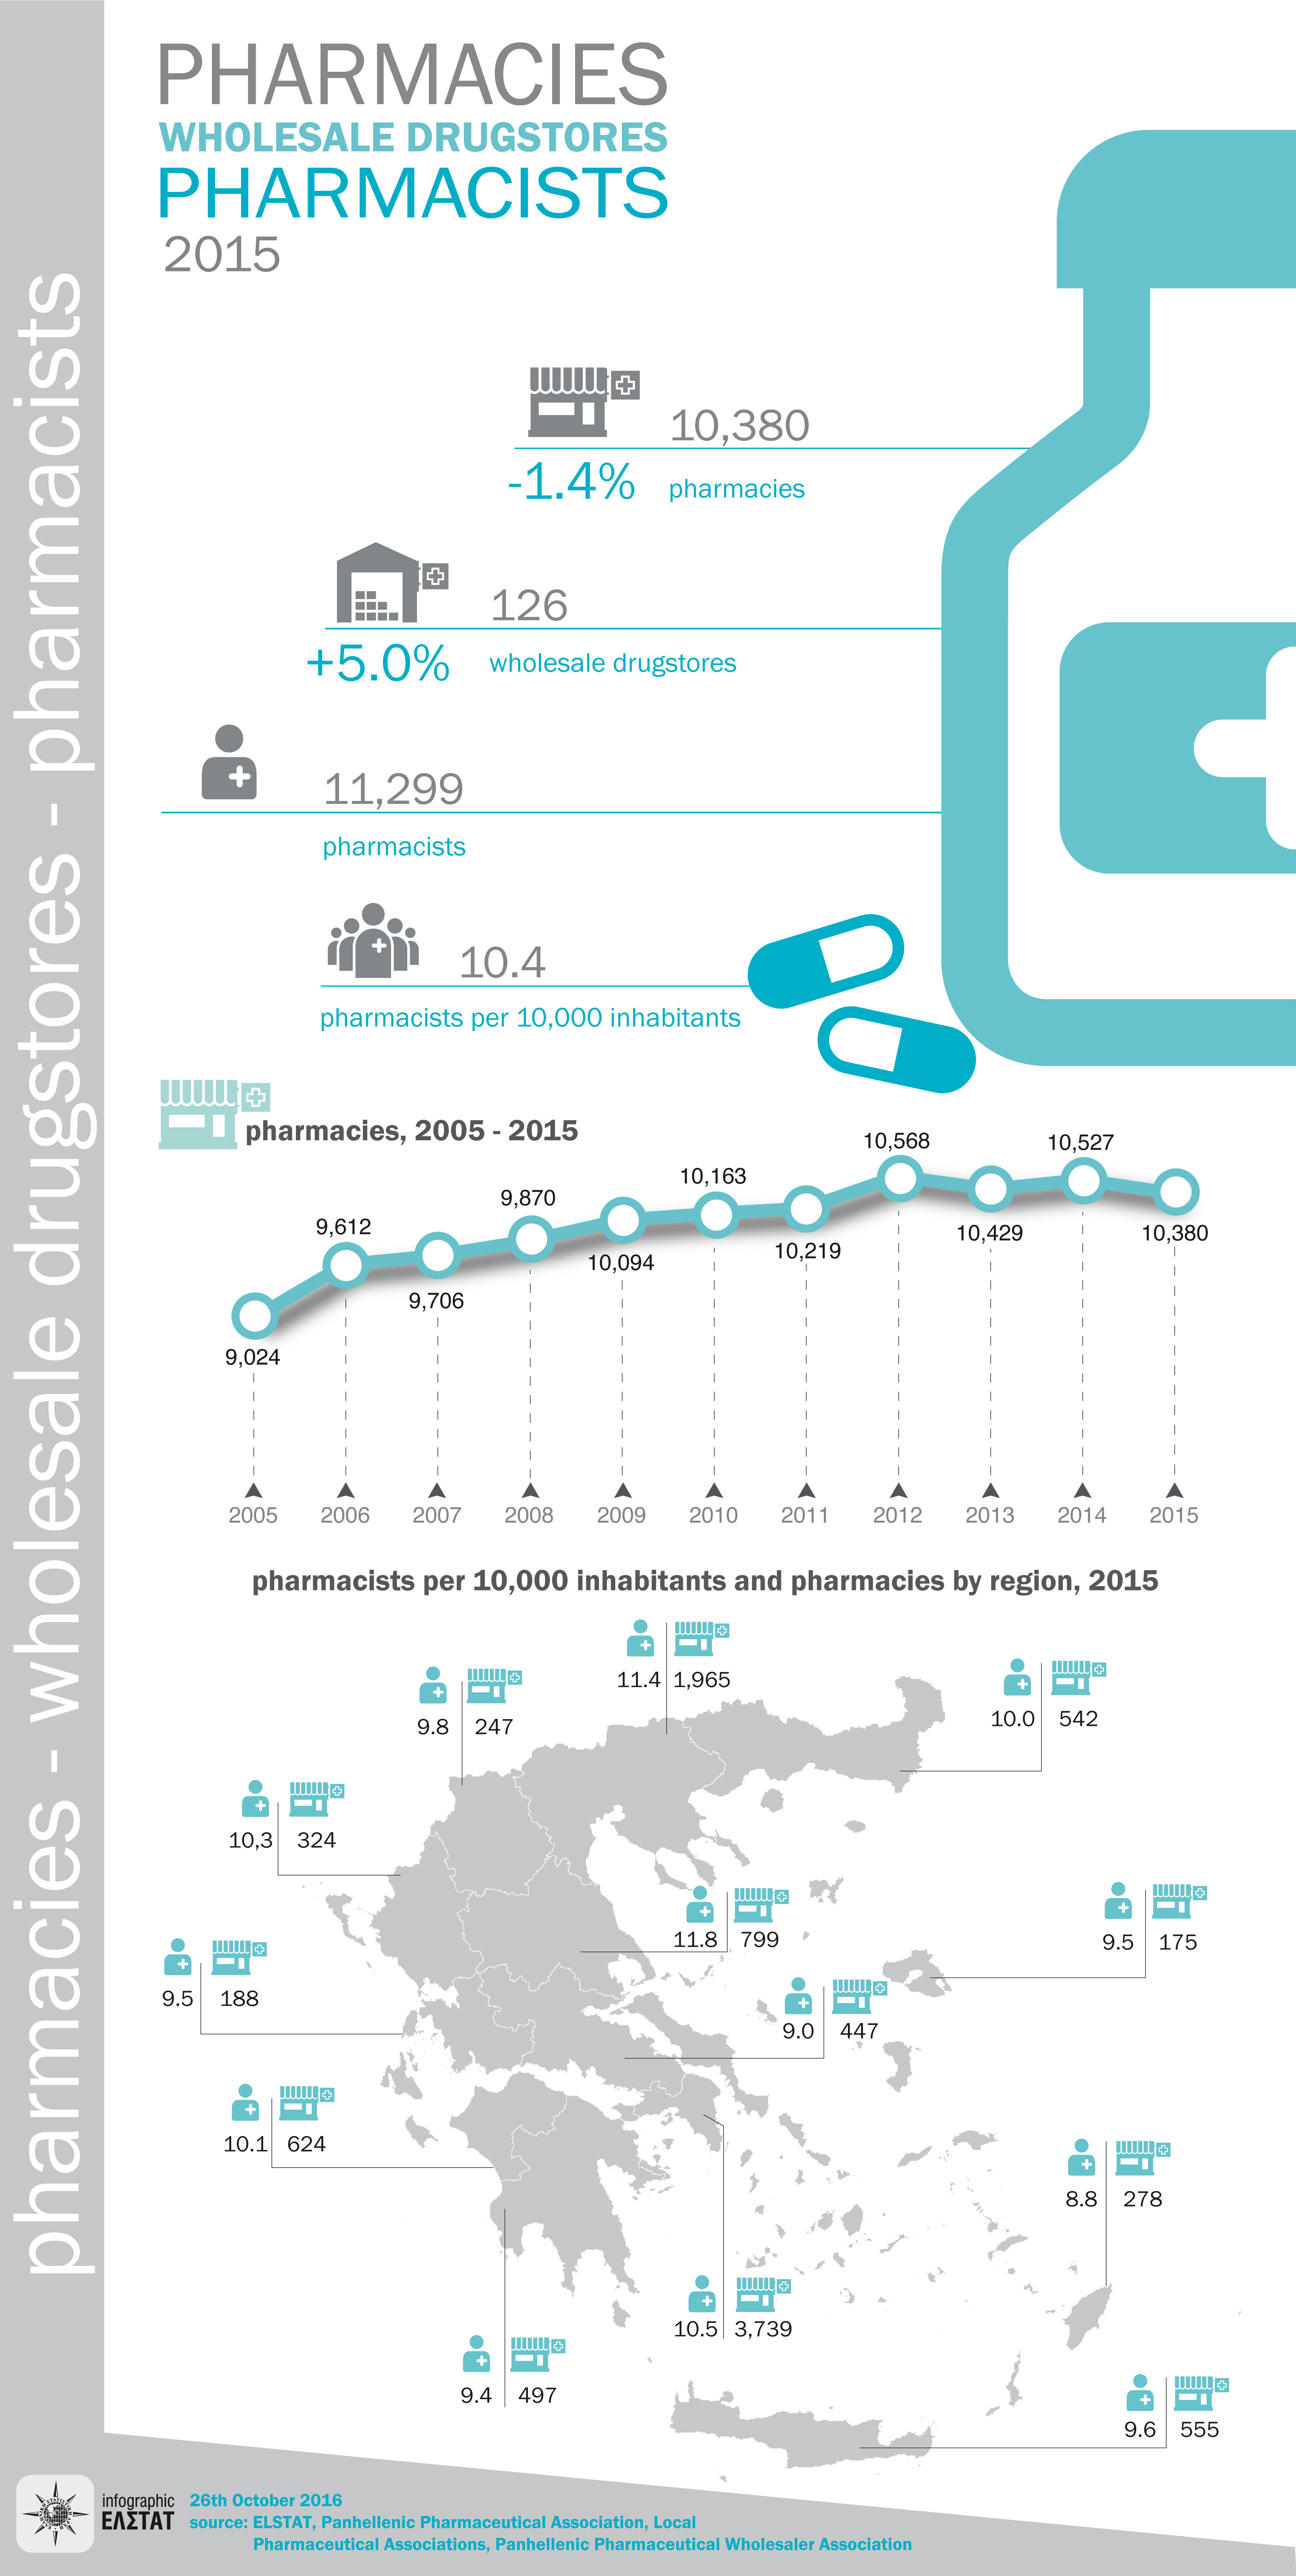
26.10.2016
2015 Pharmacies-Pharmacists and Wholesale Drugstores
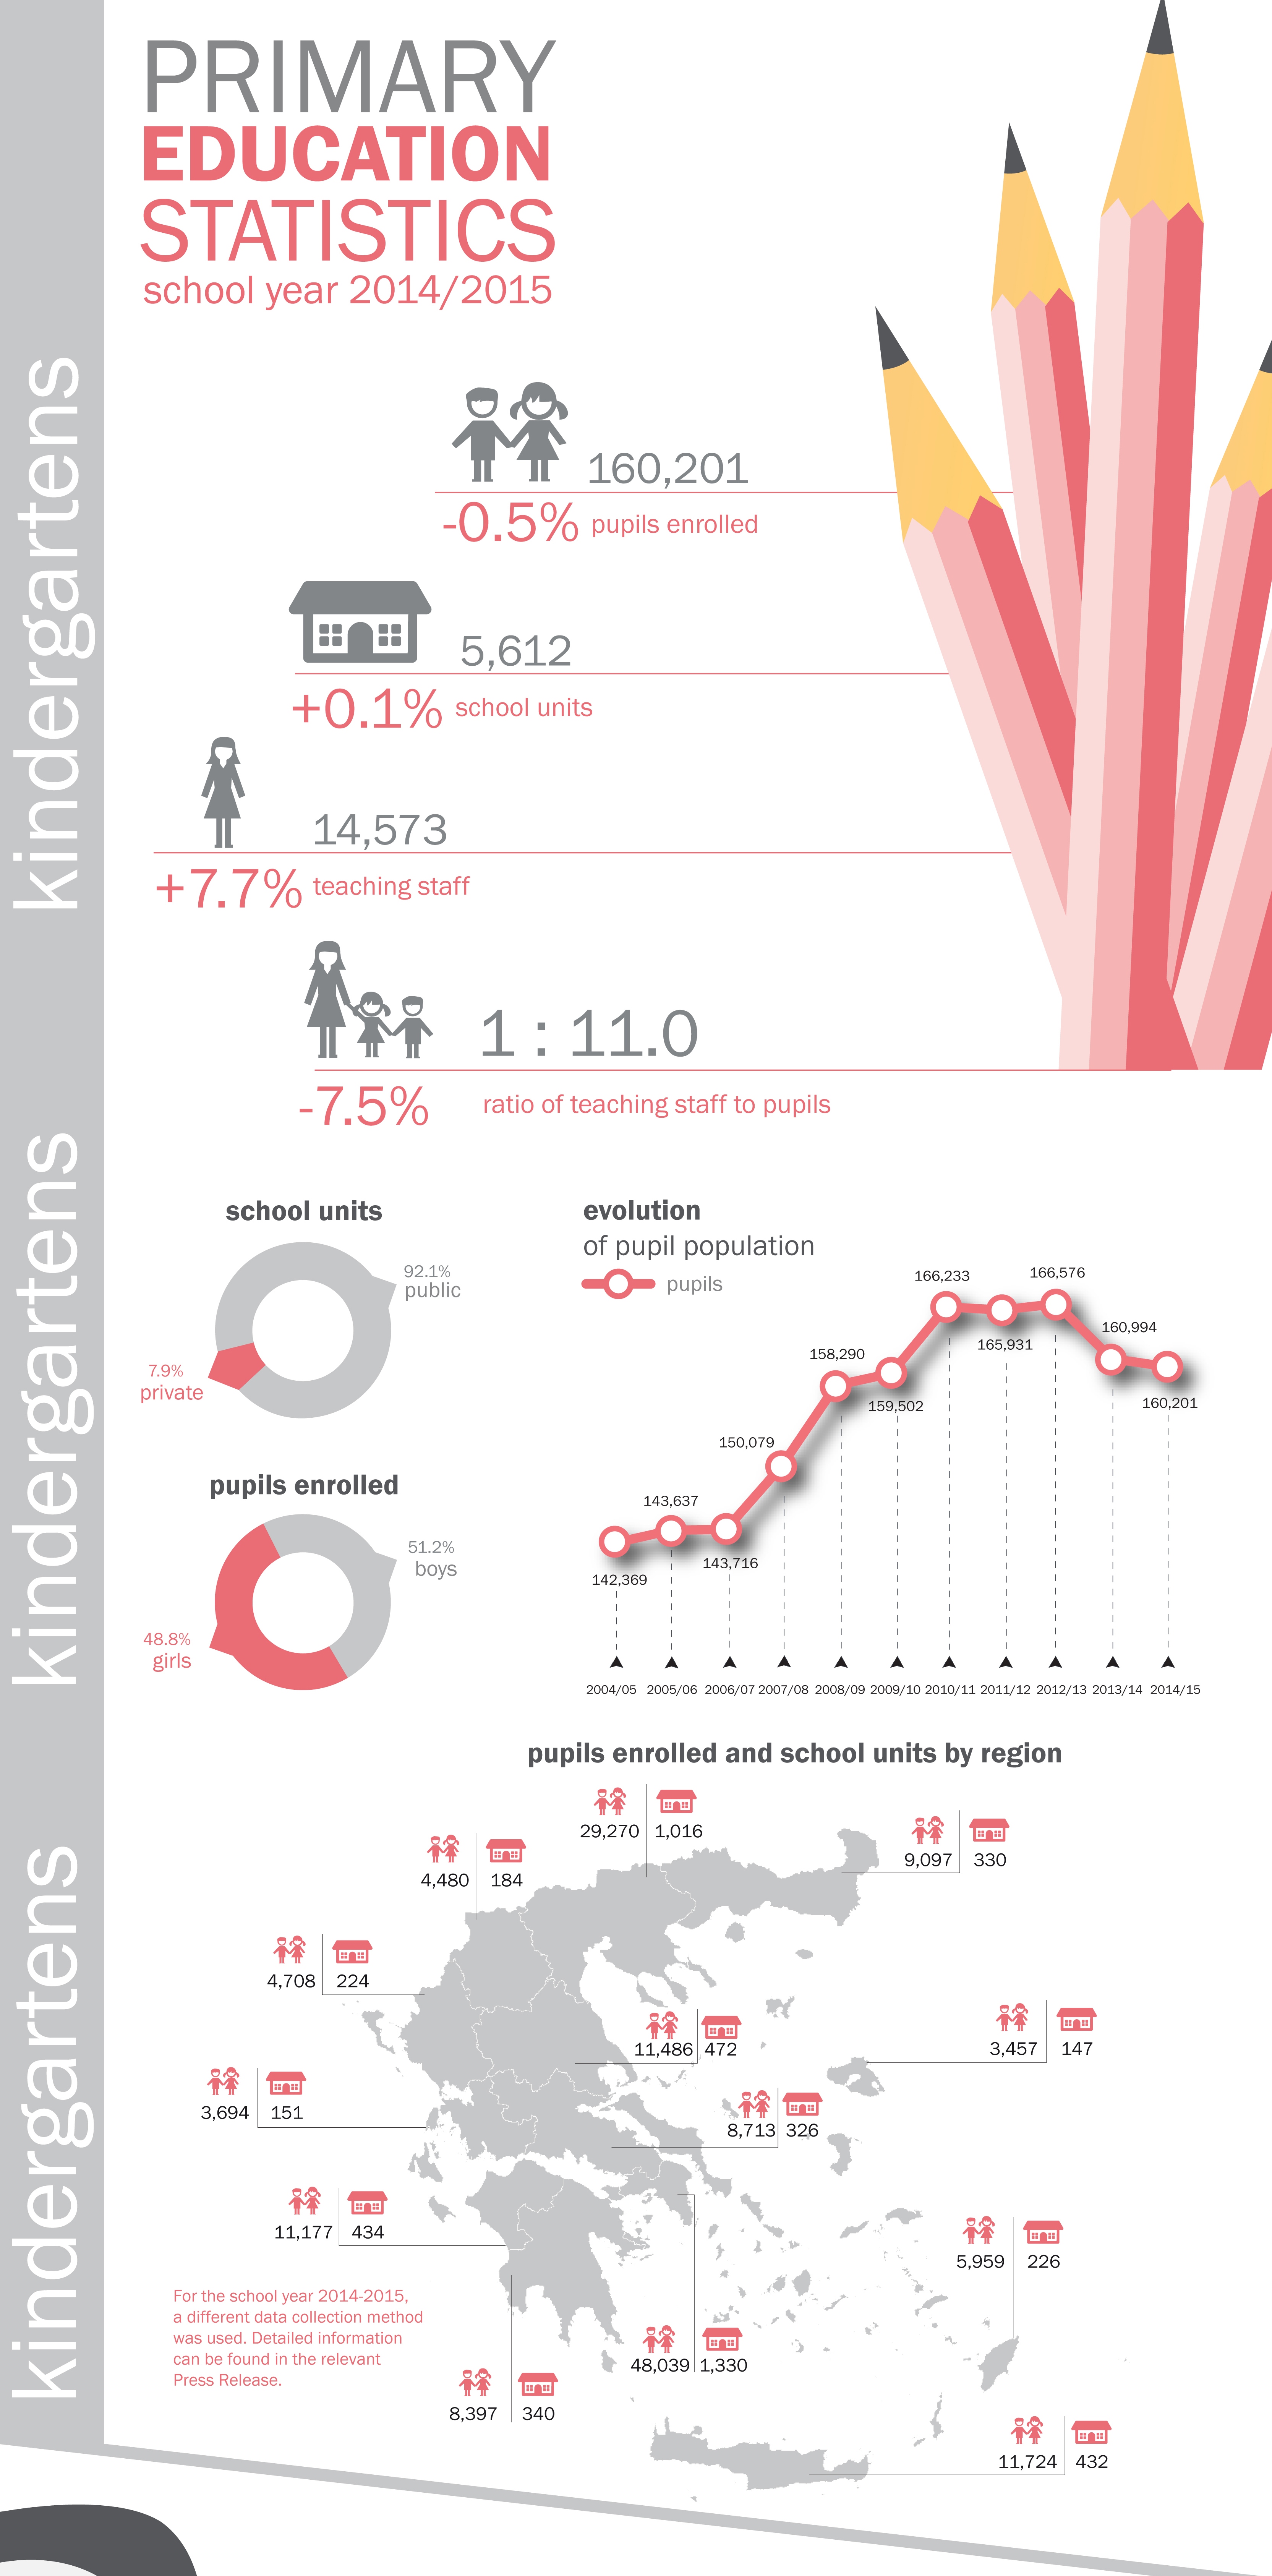
18.10.2016
2014/2015 Primary Education Statistics
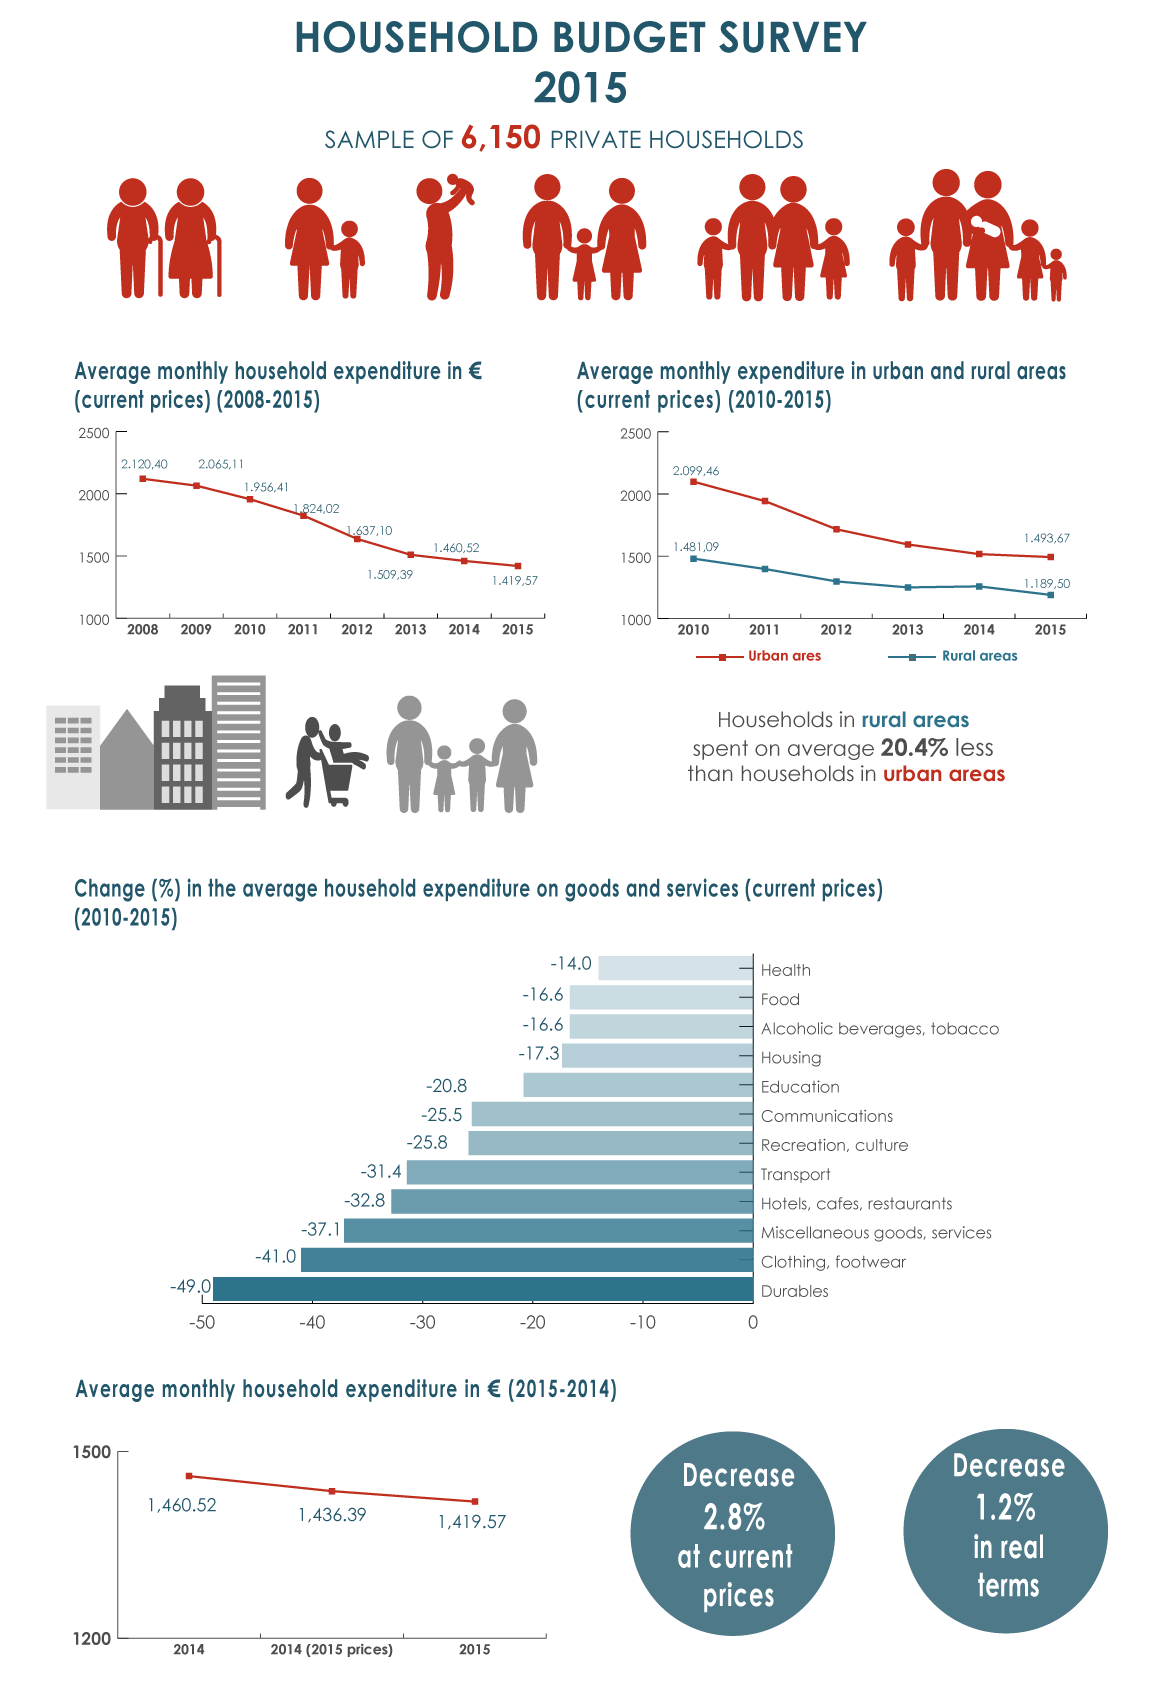
04.10.2016
2015 Household Budget Survey
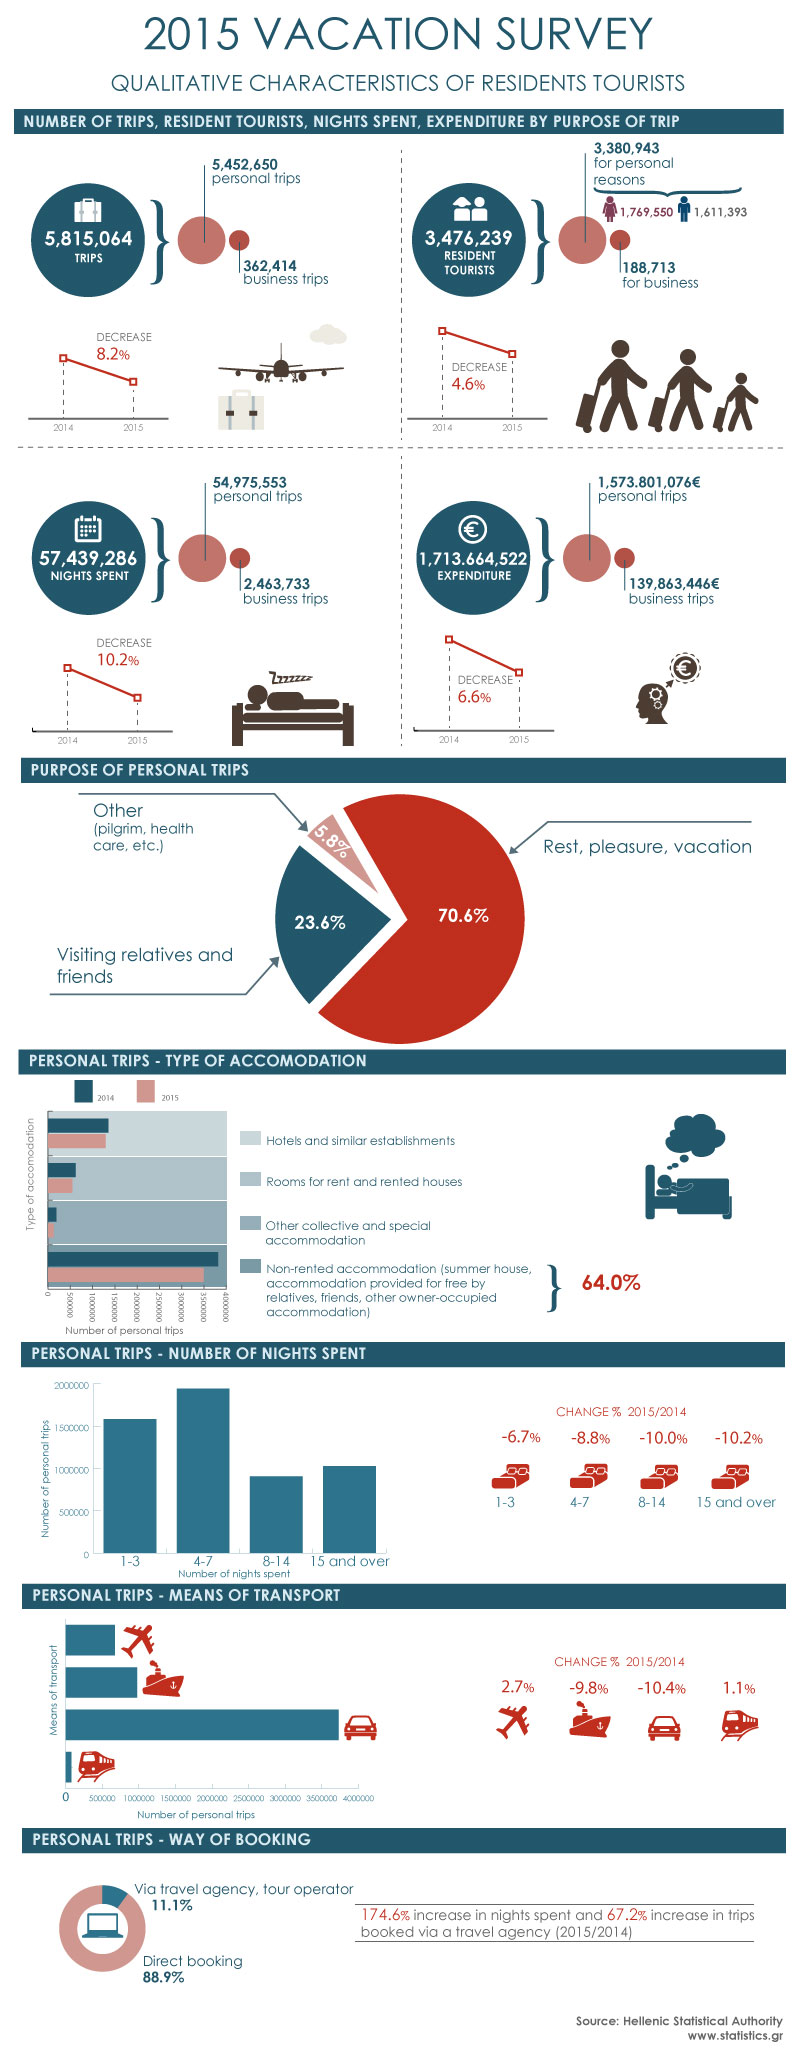
30.9.2016
2015 Vacation Survey
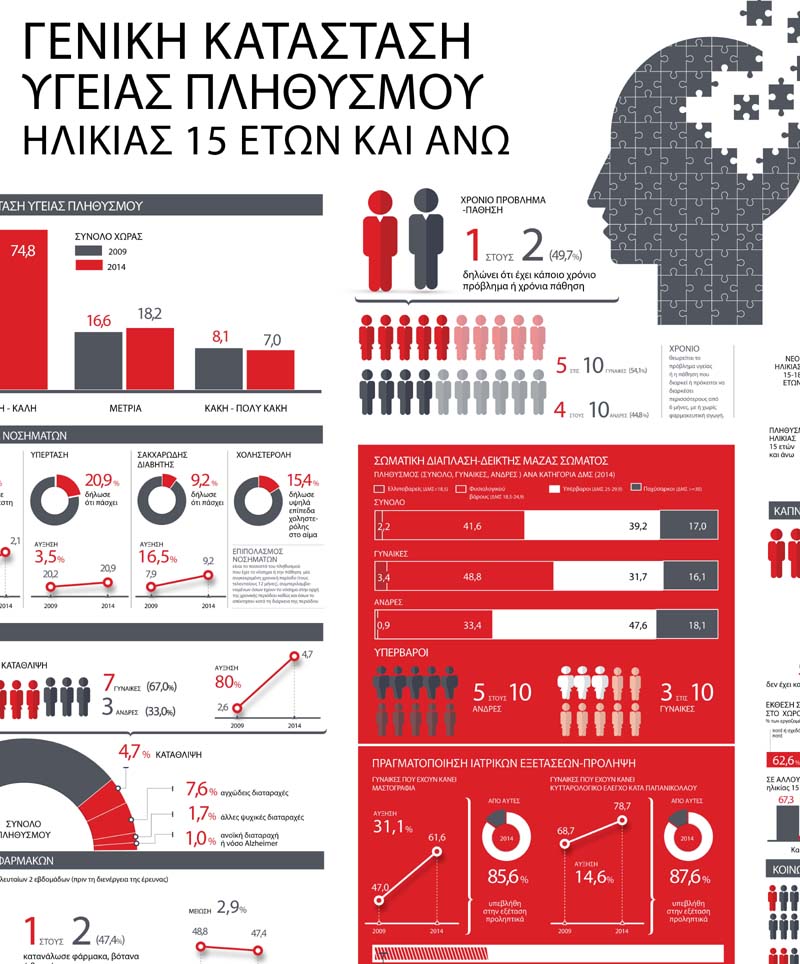
10.9.2016
2014 Health Interview Survey (HIS)
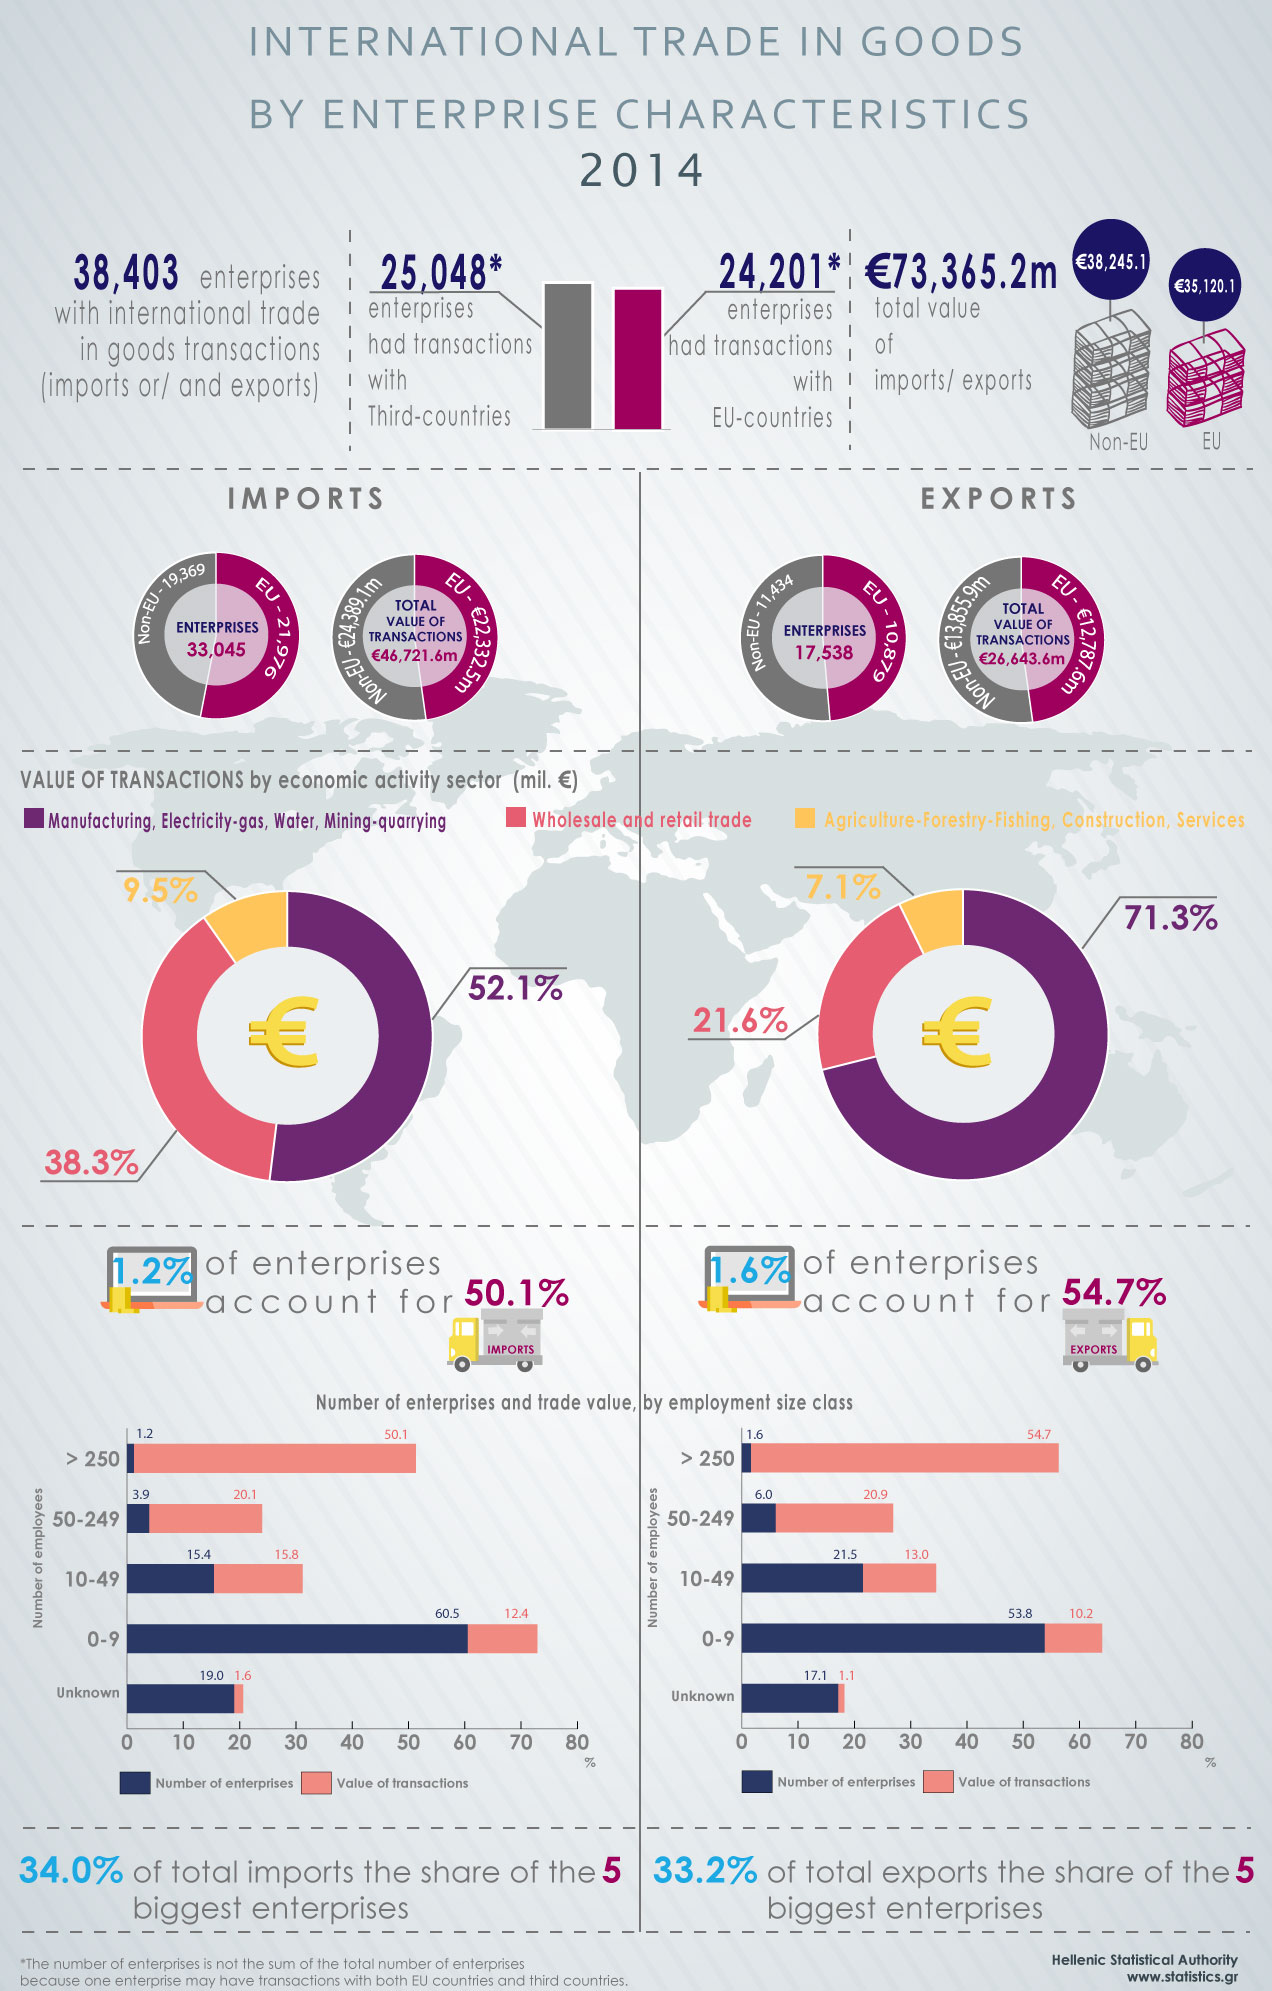
29.7.2016
2014 International trade in goods by enterprise characteristics